News & Updates

The Bigger Picture: Research and Analysis to Make Data Meaningful and Inform Action
As the Research and Analysis Lead at Hawaiʻi Data Collaborative (HDC), Kendrick Leong works with local organizations to develop actionable insights, contribute to collective understanding, and develop strategies to better address household need. Part storytelling, part hypothesis development and testing, and part contextualization, HDC’s research and analysis support elevates actionable data insights from those working closest to an issue to make a real difference for nonprofits, policy makers, and the people they serve.
In this blog post, Kendrick shares HDC’s research and analysis process that consists of five steps designed to operationalize and maximize the value of available data.

Uplifting Our Community Through Building Data Capacity
Over the past year, through our community partnerships, our team heard a consistent desire for capacity boosts to address organizational data challenges. Oftentimes, the challenge is so great that understanding where to even begin is the biggest barrier! At the Hawai‘i Data Collaborative, we aspire to be a gateway to a full spectrum of data support services to enhance the data capacities of organizations working to support households in need. We welcome you to read this blog post to learn more about how we support our partners in building their internal data capacities to unlock the data insights they need to inform their work.

Open Access to Hawaii.PolicyMap Renewed for Another Year
We are pleased to announce that open access to Hawaii.PolicyMap will continue to be available for another year, thanks to the generosity of The Harry & Jeanette Weinberg Foundation, Hawai‘i Energy, and Hawai‘i State Department of Health, who have come alongside the Hawai‘i Data Collaborative to sponsor the Hawaii.PolicyMap Enterprise License.

It’s the Journey, and the Destination: The Never-Ending Data Story
In the not-so-ideal scenario where your data doesn’t support your hunch, do you stop there? You might, but there is a lot of learning that comes from results you do not expect. You may challenge yourself and ask: are my assumptions about this problem flawed? What else have I learned along the way? What factors might I have overlooked?
We recognize that taking time to examine your results in the context of your research question, and broader research problem, is not always possible for leaders who need to make urgent decisions. However, the key is to lean into the ambiguity and understand that regardless of the result of an analysis, leveraging data to make decisions is an ongoing process. At each critical point—including the moment from examining assumptions, evaluating data, and interpreting results—there are opportunities to pause and get ‘feedback’ about how we understand the problem and the factors we perceive to be relevant (e.g. the data source, the data itself).

Checking Up on Hawaii’s Economic Health: Existing Metrics Tell Us Only Pieces of the Story
Although measures of GDP, unemployment, and retail and food sales all help assess the state of the local economy, there are a few caveats. One is data timeliness, or the schedule in which data is published and disseminated. GDP, reported quarterly, and retail and food sales, generally reported monthly, are often too slow to inform policy and planning decisions that need to be made and adjusted daily or weekly. However, Hawaii does do a good job in tracking unemployment claims weekly through the Hawaii Workforce Infonet, at least giving us a sense of the local job market. Another is data completeness, or how comprehensive a dataset is for answering the question at hand – in this case: how well is Hawaii’s economy recovering? Without one single identifiable metric for economic recovery, we need to look at other indicators beyond GDP, unemployment, and retail and food sales.

The Importance of Leading and Lagging Indicators for Ongoing Monitoring of COVID-19 in Hawaii
While it likely makes sense to most of us that these indicators measure different components of COVID-19 management – i.e. new cases, daily test rates, hospitalizations, etc. – it might be more difficult to understand how they all fit together, and why it is important to have a balance of indicators that represent the range of relevant factors for managing COVID-19 locally. One important frame to consider is distinguishing where data points fall along the continuum of leading to lagging indicators.

E Komo Mai: How Do We Reopen Hawaii to Travel?
Getting the visitor industry back on its feet is one of the state’s top priorities. But how? Given what we know about the virulence of COVID-19, the risk of future outbreaks is clearly tied to movement of people and the introduction of large populations from outside the state.

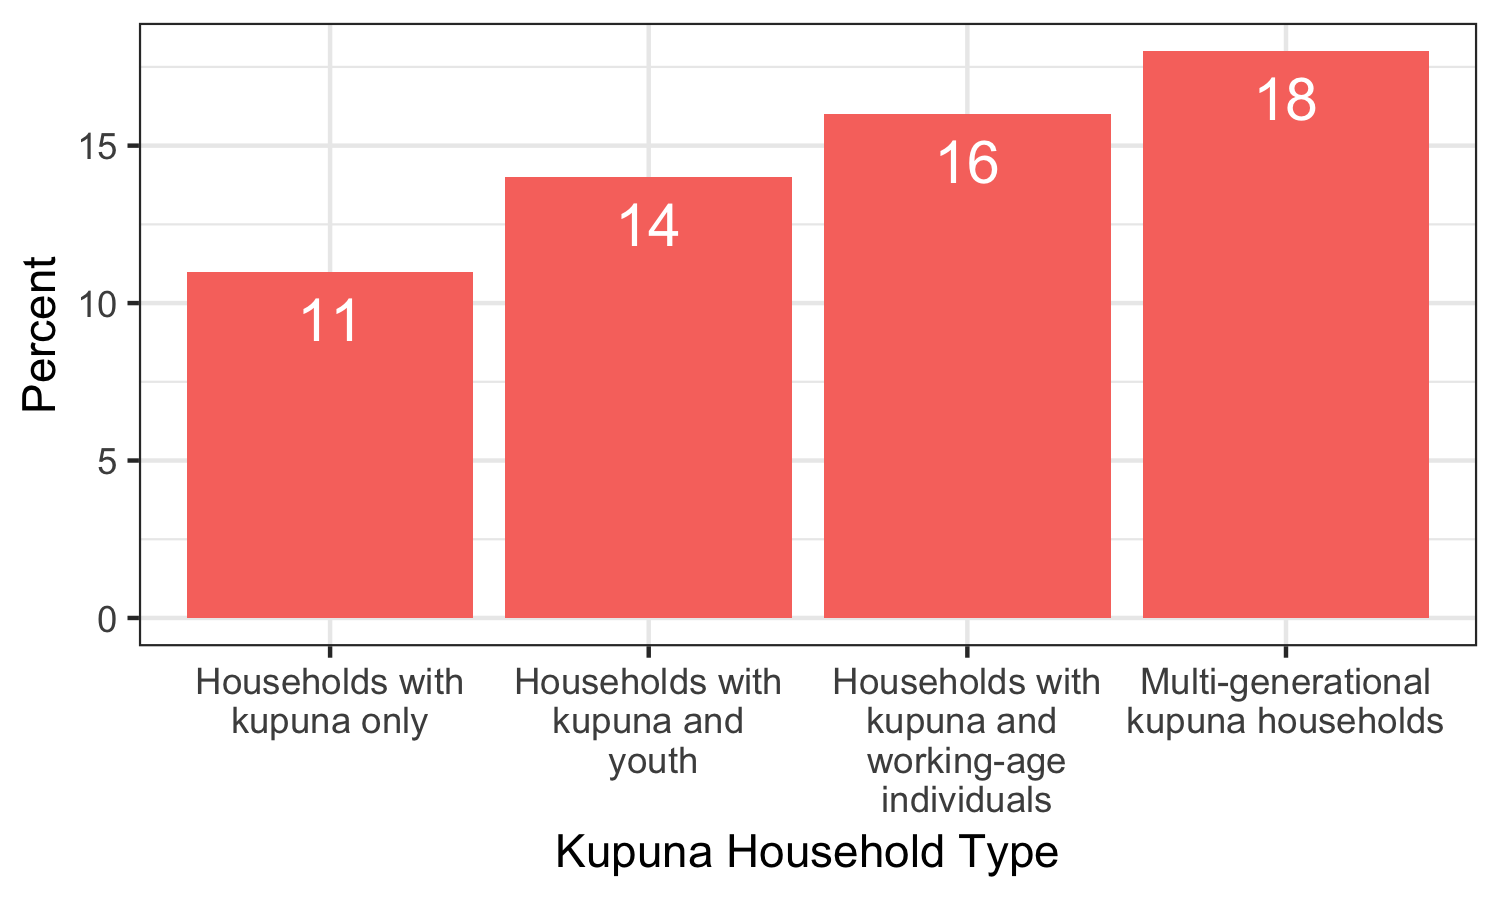
Our Kupuna: Understanding their Risks
Our findings suggest that transmission of COVID-19 is more likely to occur among younger individuals who are more active in the community. In our survey, individuals between the ages of 25 to 44 were the most likely (19%) to report symptoms of COVID-19 or have a household member who tested positive for the virus when compared with other age groups.

Ongoing and Comprehensive Information Key to Reopening Hawaii
More importantly, some communities reported higher rates of COVID-19 related symptoms compared to their response rate (e.g. Waianae and Maui)—an indication that these communities may require additional information and resources to mitigate the impacts of the virus. Conversely, communities with lower reported symptoms relative to their response rate may have greater access to information that is helping to protect its citizens (e.g. East Honolulu).

Local Expert-Driven COVID-19 Models for Hawaii Are Long Overdue
We learned the hard way that modeling COVID-19 forecasts is not one-size-fits-all. Recently, we wrote about the advantages of the University of Washington IHME model for understanding peak hospital demand in Hawaii, only to shortly thereafter advise caution in interpreting the model because the projected hospital capacity peak had suddenly shifted by three weeks [link]. A closer inspection of the model revealed problematic assumptions, and underscored a real vulnerability for Hawaii in not having a valid local model.

Insights from the Hawaii COVID Contact Tracking Survey
This is the first in a series posts highlighting results from the Hawaii COVID Contact Tracking Survey conducted by the National Disaster Preparedness Training Center (NDPTC) and the Pacific Urban Resilience Lab (PURL) at University of Hawaii at Manoa. The Hawaii Data Collaborative has partnered with this group to share regular analyses and updates from this survey in the coming weeks.

Three Questions to Ask Before You Start Collecting Data
Whether it’s talk of “big data” in the business world, predictive data analytics in the public sector, or data-informed program strategy among nonprofits, data collection and analysis are increasingly seen as requirements for savvy organizations. As our reliance on technology continues to grow, you might be feeling a sense of urgency about jumping on the data train. Identifying the right tools for data collection suddenly feels critical to your company’s success. But where to begin?
